Scope of data calculation
The terms below are used to indicate the scope of calculation for the data provided.
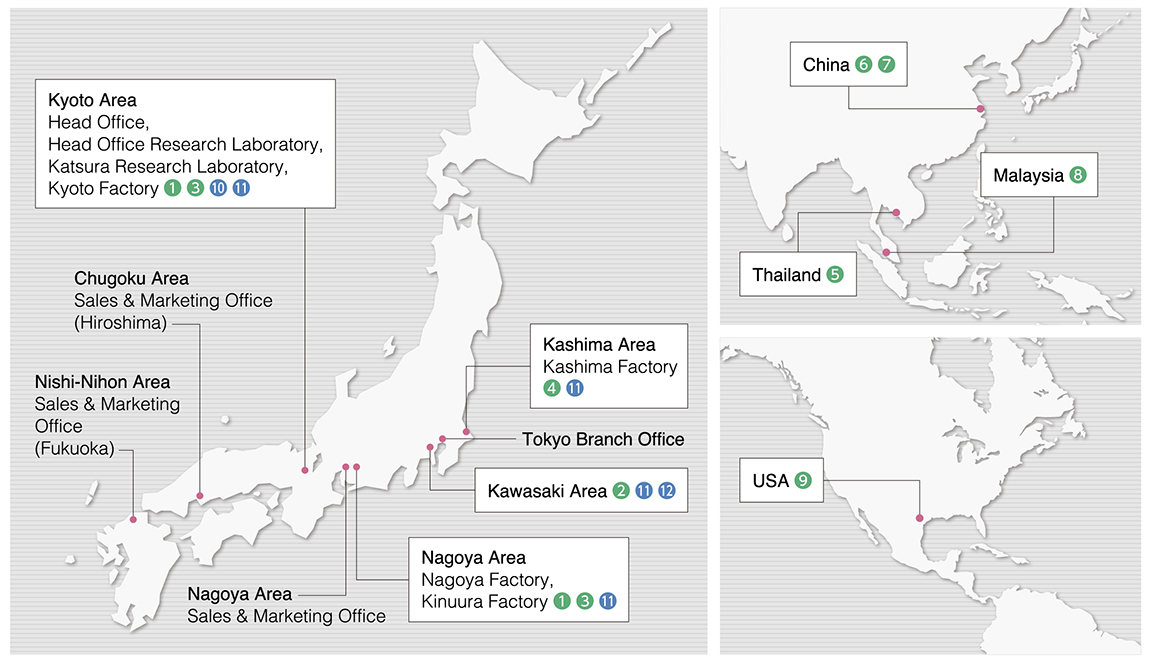
- “SCI” indicates all facilities of Sanyo Chemical Industries, Ltd.
- “Domestic” indicates SCI, SDP Global Co., Ltd., San Chemical Co., Ltd., SAN NOPCO LIMITED, San-Petrochemicals Co., Ltd., San-Apro Ltd., Sanyo Chemical Logistics Co., Ltd., Shiohama Chemicals Warehouse Co., Ltd.
- “Overseas” indicates overseas affiliates/subsidiaries that have production facilities (Sanyo Kasei (Thailand) Ltd., San-Dia Polymers (Nantong) Co., Ltd., Sanyo Chemical Texas Industries, LLC).
- For facilities with no notation, the scope is “domestic” plus “overseas.”
- SDP Global Co., Ltd. was absorbed by Sanyo Chemical on April 1, 2025, and San-Dia Polymers (Nantong) Co., Ltd. transferred its stake during FY2024, but data shown here includes FY2024 figures for these companies.
Period: April 1, 2024 - March 31, 2025
However, Sanyo Kasei (Thailand) Ltd. uses a fiscal year from January 1, 2024 to December 31, 2024, the same as its reporting period.
ISO Certification
*Horizontally scrollable
*Horizontally scrollable
| Location | Facility | Year of establishment (operation) |
ISO14001 | ISO9001 | |||
|---|---|---|---|---|---|---|---|
| Year acquired | Certification authority | Year acquired | Certification authority | ||||
| Production Base | - | Kashima Factory, Sanyo Chemical Industries, Ltd. |
1977 | - | - | 1997 | JCQA |
| - | Kyoto Factory, Sanyo Chemical Industries, Ltd. |
1949 | - | - | 1999 | JCQA | |
| - | Nagoya Factory, Sanyo Chemical Industries, Ltd. |
1969 | - | - | 1998 | JCQA | |
| - | Kinuura Factory, Sanyo Chemical Industries, Ltd. |
2010 | - | - | 2010 | JCQA | |
| (1) | San Chemical Co., Ltd. | 1982 | - | - | 2000 | JCQA | |
| (2) | SAN NOPCO LIMITED | 1966 | - | - | 2000 | JCQA | |
| (3) | San-Petrochemicals Co., Ltd. | 1977 | - | - | - | - | |
| (4) | Sanyo Kasei (Thailand) Ltd. | 1997 | 2009 | TICA/J-VAC | 2004 | TICA/J-VAC | |
| (5) | Sanyo Chemical Texas Industries, LLC | 2005 | - | - | - | - | |
| Non-production Base | (6) | San-Apro Ltd. | 1966 | - | - | 2003 | JCQA |
| (7) | Sanyo Chemical Logistics Co.,Ltd. | 2020 | - | - | - | - | |
| (8) | Shiohama Chemicals Warehouse Co.,Ltd. | 1983 | - | - | - | - | |
-
The four Sanyo Chemical factories and domestic subsidiaries and affiliates (1) through (3) discontinued their ISO14001 certification in FY2020.
(3) San-Petrochemicals Co., Ltd. also discontinued its ISO9001 certification in FY2020.
Data Concerning Environmental Investment and Environmental Efficiency
Environmental Accounting Results
Trends in aggregate values by classification based on the Environmental Accounting Guidelines (2005 version)
Scope: Domestic and overseas (except for SDP Global Co., Ltd., San-Dia Polymers (Nantong) Co., Ltd.)
*Horizontally scrollable
Classification According to Business Activity
Investment/expenses (unit: million yen)
| Classification | FY2020 | FY2021 | FY2022 | FY2023 | FY2024 | |
|---|---|---|---|---|---|---|
| Facility area expenses | (1) Pollution prevention expenses | 260/843 | 216/842 | 297/875 | 164/884 | 235/841 |
| (2) Global environmental conservation expenses | 81/650 | 64/671 | 27/663 | 31/640 | 65/549 | |
| (3) Resource recycling expenses | 41/1,850 | 1/1,794 | 1/1,898 | 58/1,378 | 0/1,202 | |
| Upstream/downstream expenses | 0/34 | 2/40 | 0/33 | 0/32 | 0/35 | |
| Administrative expenses | 1/459 | 55/475 | 3/505 | 0/411 | 0/346 | |
| R&D expenses* | 0/464 | 0/663 | 0/730 | 0/760 | 0/2,331 | |
| Social activity expenses | 0/124 | 0/132 | 0/138 | 0/154 | 0/190 | |
| Environmental remediation expenses | 20/5 | 0/3 | 0/4 | 0/3 | 0/0 | |
| Total | 404/4,428 | 338/4,620 | 327/4,846 | 252/4,263 | 301/5,495 | |
- Investment amounts are based on receiving inspections for the period in question. Expense amounts include depreciation.
- Calculation method changed in FY2024
*Horizontally scrollable
Classification According to Environmental Conservation Measures
Investment/expenses (unit: million yen)
| Classification | FY2020 | FY2021 | FY2022 | FY2023 | FY2024 |
|---|---|---|---|---|---|
| (1) Global warming measures | 40/633 | 19/646 | 34/642 | 37/630 | 65/546 |
| (2) Ozone layer protection measures | 0/1 | 1/5 | 0/2 | 0/5 | 0/4 |
| (3) Air-quality conservation measures | 185/394 | 232/391 | 224/408 | 136/407 | 153/393 |
| (4) Noise and vibration measures | 5/75 | 1/64 | 0/74 | 0/70 | 0/65 |
| (5) Environmental conservation measures for the aquatic, ground, and geologic environments |
136/414 | 73/432 | 62/456 | 44/446 | 82/399 |
| (6) Waste and recycling measures | 34/1,857 | 1/1,803 | 1/1,906 | 58/1,383 | 0/1,204 |
| (7) Measures for reducing chemical risk and emissions | 0/282 | 0/277 | 0/259 | 0/204 | 0/222 |
| (8) Natural environment conservation | 0/16 | 3/17 | 1/16 | 0/12 | 0/12 |
| (9) Other | 3/292 | 9/322 | 5/354 | 4/346 | 1/318 |
| Total | 404/3,963 | 338/3,957 | 327/4,116 | 279/3,504 | 301/3,163 |
- R&D investment/expenses are not classified
*Horizontally scrollable
Economic Impact of Environmental Conservation Measures (monetary units)
(unit: million yen)
| Classification | FY2020 | FY2021 | FY2022 | FY2023 | FY2024 | |
|---|---|---|---|---|---|---|
| Energy savings | 6 | 41 | 20 | 26 | 105 | |
| Resource savings | Waste reduction | 48 | 77 | 7 | 40 | 78 |
| Raw material use reduction | 174 | 152 | 82 | 137 | 52 | |
| Revenue from recycling | 52 | 55 | 70 | 78 | 61 | |
| Total | 279 | 325 | 179 | 281 | 296 | |
- Includes effects of non-investment measures (e.g., process improvements )
*Horizontally scrollable
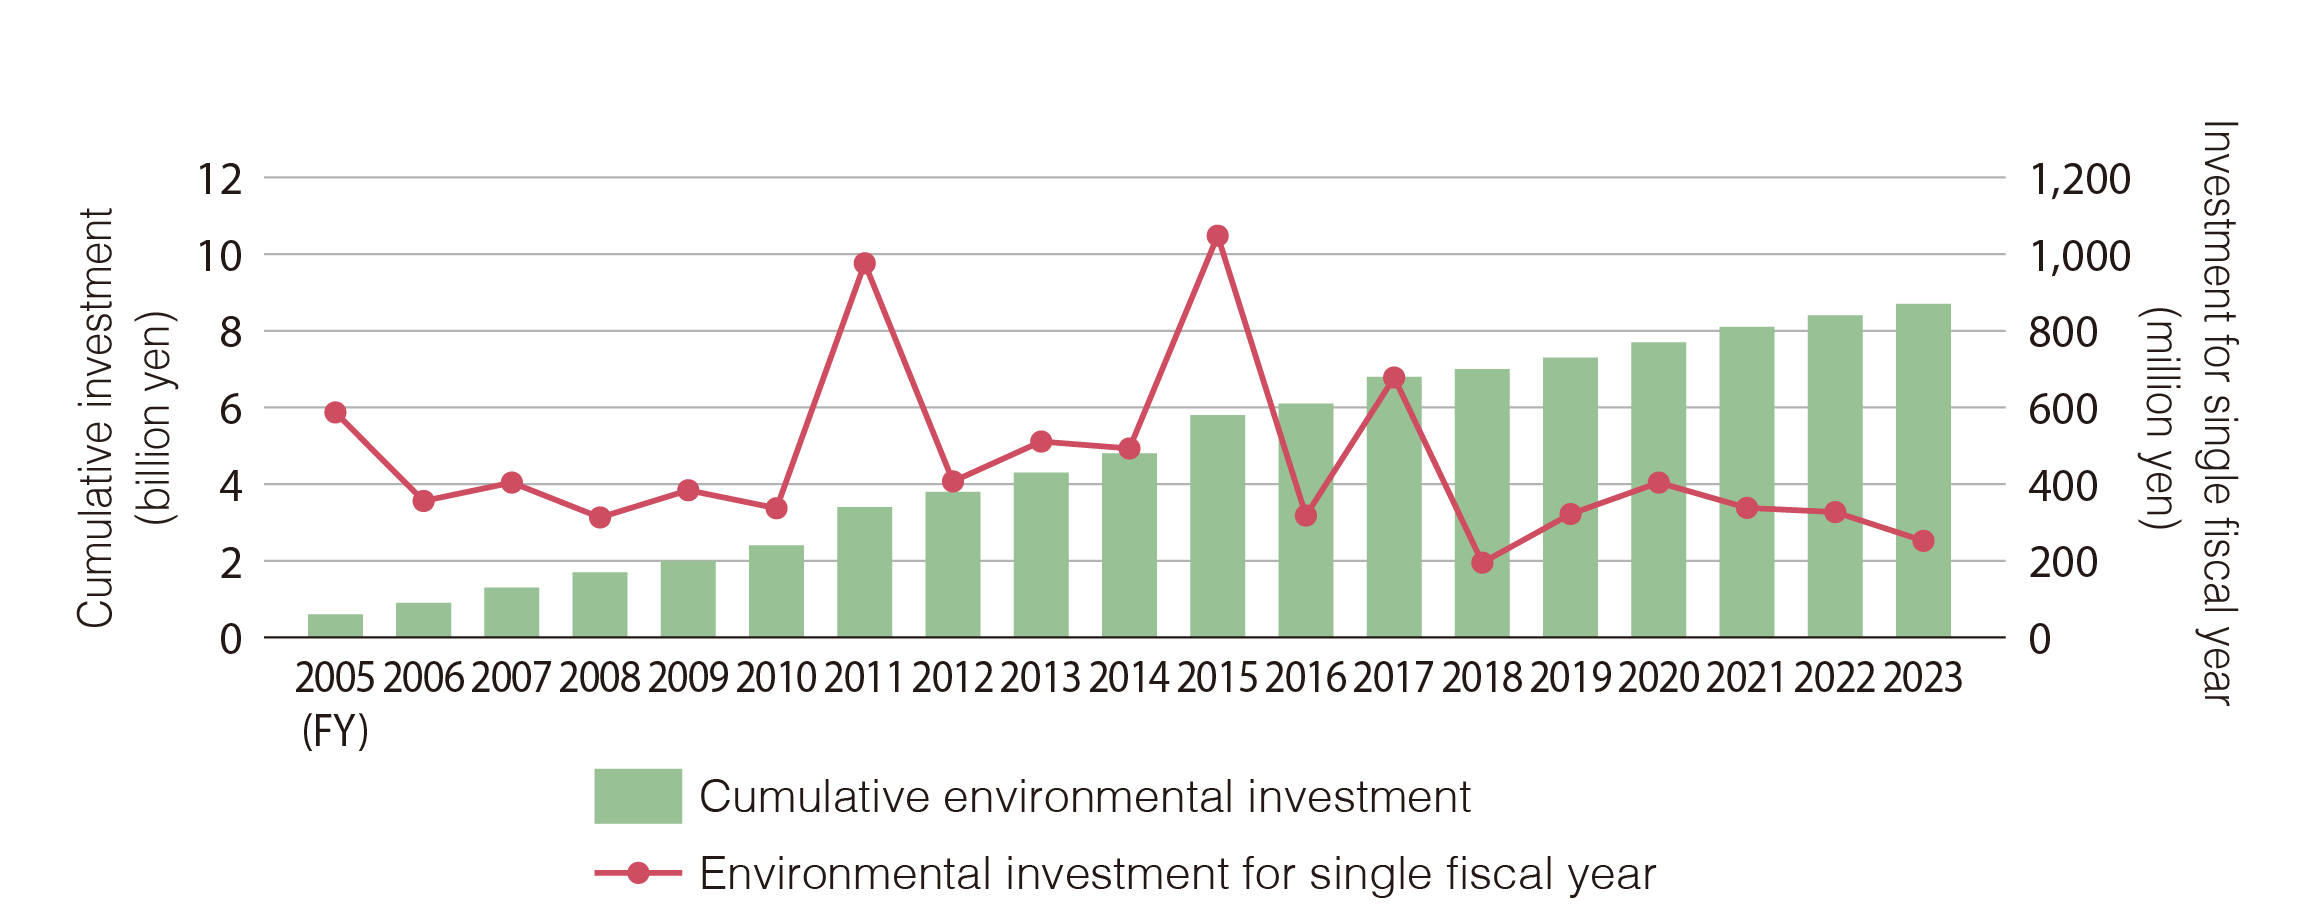
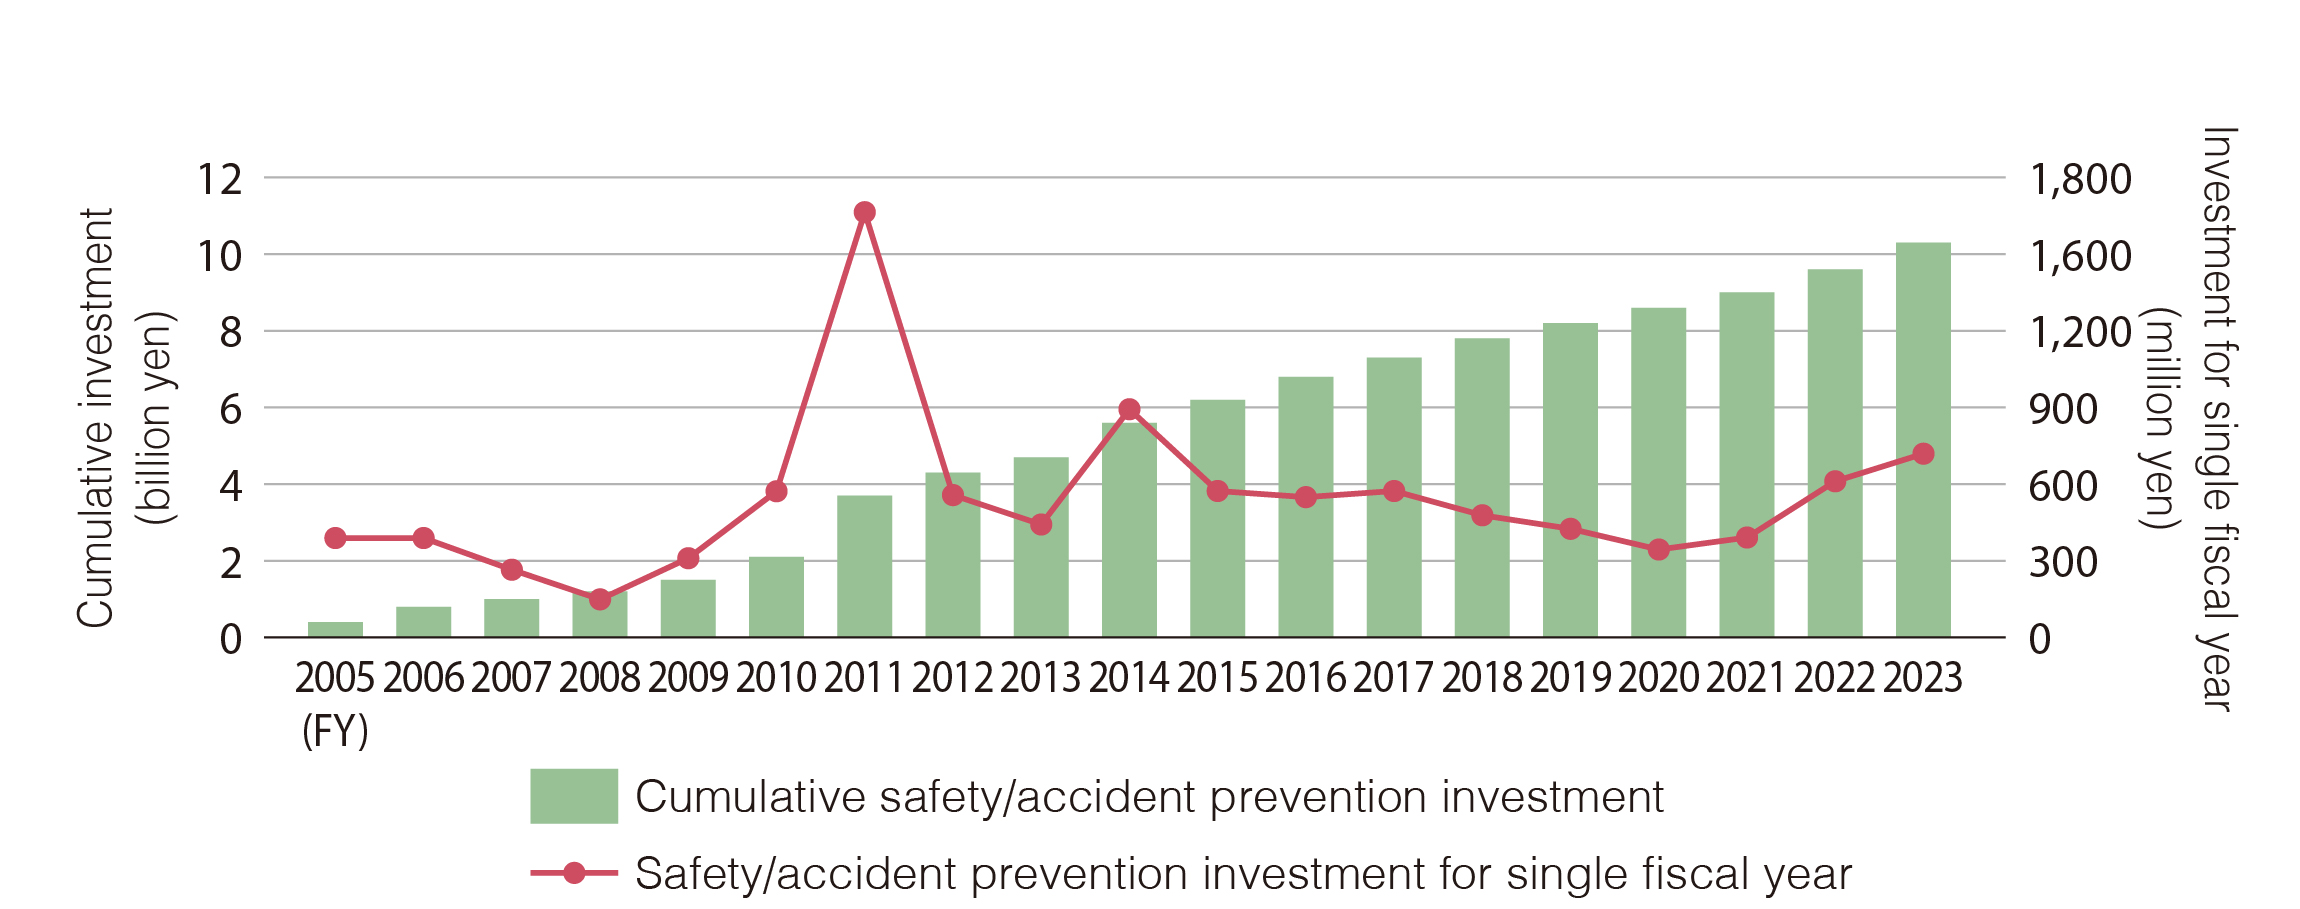
Environment, Safety, and Accident Prevention Investment
(unit: million yen)
| FY2020 | FY2021 | FY2022 | FY2023 | FY2024 | |
|---|---|---|---|---|---|
| Environmental conservation | 404 | 338 | 327 | 252 | 301 |
| Safety/accident prevention | 344 | 391 | 611 | 719 | 636 |
| Total | 747 | 729 | 938 | 971 | 937 |
Cumulative environmental investment (since FY2005)
Cumulative safety/accident prevention investment (since FY2005)
Climate Change Related Data
Energy Related Data
*Horizontally scrollable
| unit | Scope | FY2020 | FY2021 | FY2022 | FY2023 | FY2024 | ||
|---|---|---|---|---|---|---|---|---|
| Production volume | tons | Domestic | 332,320 | 343,716 | 317,848 | 283,209 | 233,063 | |
| Overseas | 238,468 | 179,998 | 149,516 | 162,413 | 81,359 | |||
| Total | 570,788 | 523,714 | 467,365 | 445,622 | 314,422 | |||
| Raw material input | tons | Domestic | 383,120 | 400,002 | 362,825 | 305,929 | 267,712 | |
| Overseas | 319,739 | 236,875 | 198,151 | 206,452 | 8,261 | |||
| Total | 702,859 | 636,877 | 560,976 | 512,380 | 275,973 | |||
| Energy consumption | Crude oil equivalent kL | Domestic | 81,073 | 81,013 | 78,229 | 64,917 | 56,857 | |
| Overseas | 64,981 | 51,205 | 44,993 | 43,072 | 19,992 | |||
| Total | 146,054 | 132,218 | 123,221 | 107,989 | 76,850 | |||
| Energy consumption intensity per production volume | Crude oil equivalent kL/ton | Domestic | 0.244 | 0.236 | 0.246 | 0.229 | 0.244 | |
| Overseas | 0.272 | 0.284 | 0.301 | 0.265 | 0.246 | |||
| Total | 0.256 | 0.252 | 0.264 | 0.242 | 0.244 | |||
| Energy generated on-site (cogeneration) |
Crude oil equivalent kL | Domestic | 15,975 | 13,165 | 13,332 | 9,878 | 9,584 | |
| Overseas | 2,824 | 2,782 | 3,047 | 1,555 | 0* | |||
| Total | 18,799 | 15,946 | 16,379 | 11,433 | 9,584 | |||
| Renewable energy use (solar power generation) |
Crude oil equivalent kL | Domestic | 12 | 13 | 13 | 5 | 11 | |
| Overseas | 30 | 32 | 20 | 11 | 17 | |||
| Total | 42 | 45 | 32 | 16 | 28 | |||
| Energy mix | Purchased electricity | % | Domestic and overseas | 30.4 | 33.0 | 33.1 | 31.6 | 33.1 |
| Purchased steam | 13.0 | 17.1 | 18.4 | 21.3 | 24.8 | |||
| Fuel oil | 2.0 | 0.8 | 0.5 | 2.1 | 1.9 | |||
| Natural gas | 35.6 | 37.6 | 38.1 | 30.7 | 27.2 | |||
| LPG | 19.1 | 11.6 | 10.0 | 14.3 | 13.0 | |||
- The overseas cogeneration equipment was located at SDP Global (Malaysia) SDN.BHD.
GHG Related Data
*Horizontally scrollable
| unit | Scope | FY2020 | FY2021 | FY2022 | FY2023 | FY2024 | |
|---|---|---|---|---|---|---|---|
| GHG emissions*1 | tons CO2 | Domestic | 157,715 | 153,406 | 146,565 | 122,861 | 105,968 |
| Overseas | 150,568 | 123,562 | 109,031 | 108,177 | 52,599 | ||
| Total | 308,283 | 279,968 | 255,596 | 231,038 | 158,567 | ||
| CO2 | tons | Domestic and overseas |
307,950 | 276,092 | 255,211 | 230,611 | 158,273 |
| CH4 | tons CO2 | Domestic and overseas |
10 | 10 | 10 | 30 | 24 |
| N2O | tons CO2 | Domestic and overseas |
43 | 38 | 36 | 156 | 113 |
| Fluorocarbon leakage volume*2 | tons CO2 | Domestic | 280 | 827 | 339 | 241 | 157 |
| GHG emissions intensity per unit of production | tons CO2/tons | Domestic | 0.475 | 0.446 | 0.461 | 0.434 | 0.456 |
| Overseas | 0.631 | 0.686 | 0.729 | 0.666 | 0.647 | ||
| Total | 0.540 | 0.529 | 0.547 | 0.518 | 0.505 | ||
| CO2 emissions during transport as a consignor*3 | tons CO2 | Domestic | 10,398 | 10,368 | 8,765 | 8,127 | 7,646 |
| Increase in CO2 forest absorption*4 | tons CO2 | Domestic | 13 | 39 | 11 | 20 | 13 |
| Avoided CO2 emissions by using our products*5 | 10,000tons CO2 | - | 48 | 49 | 49 | 54 | 90 |
- Calculated in conformance with the Act on Promotion of Global Warming Countermeasures. However, the CO2 conversion factors for electricity at overseas facilities conforms to the U.S. Energy Information Administration (EIA) figures in the case of the U.S.A., and to the Institute for Global Environmental Strategies (IGES) figures in the case of China, Thailand, and Malaysia.
- Volume of leakage from air conditioners, chillers, etc. based on the Act on Rational Use and Proper Management of Fluorocarbons
- Total domestic transportation for SCI; SDP Global Co., Ltd.; and SAN NOPCO LIMITED
- Increase in CO2 absorption by forest thinning and other measures in the town of Wazuka due to funding provided to the Kyoto Model Forest Association's "Forest Creation Fund" LIMITED
- Avoided CO2 emissions are calculated by comparing the emissions from conventional products with those from our products, and multiplying the difference by the sales volume for the relevant fiscal year.
The target products were reviewed in FY2024. For details, see ≫ Supporting the Environment | Environmental Performance Chemicals
- Domestic GHG emissions until FY2022 have been recalculated as they did not include fluorocarbon leakage volume.
GHG Emissions Data by Scope
*Horizontally scrollable
(unit: CO2 tons)
| FY2020 | FY2021 | FY2022 | FY2023 | FY2024 | |
|---|---|---|---|---|---|
| Scope 1 – Direct emissions | 181,509 | 145,753 | 130,031 | 105,287 | 69,315 |
| Scope 2 – Indirect emissions from the use of energy supplied by others (market basis) | 126,495 | 130,283 | 125,226 | 125,751 | 89,252 |
| Scope 3 – Sum of supply chain emissions across all categories | 2,322,571 | 2,393,025 | 2,215,054 | 1,910,981 | 1,754,201 |
| Cat 1*1 – Purchased goods and services | 1,178,559 | 1,216,830 | 1,151,303 | 1,013,918 | 922,054 |
| Cat 2 – Capital goods | 18,367 | 20,922 | 19,670 | 17,065 | 20,662 |
| Cat 3 – Fuel and energy-related activities not included in Scope 1 or 2 | 24,564 | 24,219 | 24,009 | 32,908 | 30,286 |
| Cat 4 – Upstream transportation and distribution | 21,789 | 26,482 | 20,780 | 18,492 | 21,843 |
| Cat 5 – Waste generated in operations | 409 | 812 | 820 | 23,811 | 12,301 |
| Cat 6 – Business travel | 189 | 184 | 181 | 179 | 204 |
| Cat 7 – Employee commuting | 476 | 472 | 463 | 461 | 511 |
| Cat 8*2 – Upstream leased assets | - | - | - | - | - |
| Cat 9*3 – Downstream transportation and distribution | - | - | - | - | - |
| Cat 10*3 – Processing of sold products | - | - | - | - | - |
| Cat 11*3 – Use of sold products | - | - | - | - | - |
| Cat 12 – End-of-life treatment of sold products | 1,027,575 | 1,055,712 | 948,355 | 749,945 | 698,266 |
| Cat 13*2 – Downstream leased assets | - | - | - | - | - |
| Cat 14*4 – Franchises | - | - | - | - | - |
| Cat 15 – Investments | 50,643 | 47,391 | 49,473 | 54,200 | 48,432 |
- Scope 3 emissions were calculated based on the Basic Guidelines on Accounting for Greenhouse Gas Emissions Throughout the Supply Chain issued by the Ministry of the Environment and by reference to the Ministry of the Environment's Report on Emissions Unit Values for Calculation of Greenhouse Gas Emissions, etc., by Organizations Throughout the Supply Chain. Version 2.3 is used through FY2022, and version 3.4 is used from FY2023
-
[Scope of Calculation]
- Scope 1, Scope 2: Domestic and overseas
- Scope3
Until FY2023
Cat 1-7: SCI, SDP Global Co., Ltd., San Chemical Co., Ltd.
Cat 12: SCI, SDP Global Co., Ltd., San Chemical Co., Ltd., certain products sold by overseas affiliates/subsidiaries
Cat 15: SCI
In FY2024
Cat 1:SCI, SDP Global Co., Ltd., San Chemical Co., Ltd.
Cat 2:Domestic
Cat 3:SCI, SDP Global Co., Ltd., San Chemical Co., Ltd., SAN NOPCO LIMITED, San-Petrochemicals Co. Ltd.
Cat 4:SCI, SDP Global Co., Ltd., San Chemical Co., Ltd., SAN NOPCO LIMITED, San-Petrochemicals Co. Ltd.
Cat 5:SCI, SDP Global Co., Ltd., San Chemical Co., Ltd.
Cat 6:Domestic
Cat 7:Domestic
Cat 12:SCI, SDP Global Co., Ltd., San Chemical Co., Ltd., certain products sold by overseas affiliates/subsidiaries
Cat 15:SCI
- Changed the CO2 conversion factor for purchased raw materials to "IDEA Ver. 2" of the National Institute of Advanced Industrial Science and Technology (AIST) in FY2022. Before FY2021: "Common Unit CO2 Conversion Database ver. 4.01," Ministry of the Environment of Japan, Carbon Footprint System Pilot Project
- Only leases within the group; calculated for Scopes 1 and 2
- Not calculated due to difficulty in collecting necessary data for calculation
- Out of scope as there were no relevant activities
Waste and Resource Circulation Related Data
*Horizontally scrollable
| unit | Scope | FY2020 | FY2021 | FY2022 | FY2023 | FY2024 | |
|---|---|---|---|---|---|---|---|
| Waste generated | tons | Domestic | 36,627 | 38,274 | 34,587 | 30,653 | 28,274 |
| Overseas | 8,803 | 7,891 | 9,607 | 9,371 | 3,892 | ||
| Total | 45,430 | 46,165 | 44,194 | 40,024 | 32,165 | ||
| Waste intensity per unit of production | tons/tons | Domestic | 0.110 | 0.111 | 0.109 | 0.108 | 0.121 |
| Overseas | 0.037 | 0.044 | 0.064 | 0.058 | 0.048 | ||
| Total | 0.080 | 0.088 | 0.095 | 0.090 | 0.102 | ||
| Waste emissions | tons | Domestic | 13,317 | 14,574 | 14,541 | 11,633 | 10,555 |
| Overseas | 9,004 | 7,424 | 8,562 | 8,459 | 3,876 | ||
| Total | 22,321 | 21,997 | 23,103 | 20,092 | 14,432 | ||
| Recycled waste*1 | tons | Domestic | 6,935 | 7,657 | 7,113 | 5,597 | 8,148 |
| Overseas | 3,891 | 3,315 | 4,508 | 4,377 | 625 | ||
| Total | 10,825 | 10,972 | 11,621 | 9,974 | 8,773 | ||
| Recycle rate*2 | % | Domestic | 18.9 | 20.0 | 20.6 | 18.3 | 28.8 |
| Overseas | 44.2 | 42.0 | 46.9 | 46.7 | 16.1 | ||
| Total | 23.8 | 23.8 | 26.3 | 24.9 | 27.3 | ||
| Final landfill disposal | tons | Domestic | 0.9 | 1.0 | 2.5 | 0.7 | 0 |
| Overseas | 3.0 | 5.1 | 3.9 | 3.6 | 3.0 | ||
| Total | 3.9 | 6.1 | 6.4 | 4.3 | 3.0 | ||
| Landfill rate*3 | % | Domestic | 0 | 0 | 0.01 | 0 | 0 |
| Overseas | 0.03 | 0.06 | 0.04 | 0.04 | 0.08 | ||
| Total | 0.01 | 0.01 | 0.01 | 0.01 | 0.01 | ||
| Specially controlled industrial waste*4 | tons | Domestic | 3,689 | 2,016 | 3,295 | 1,259 | 1,035 |
- Total amount of internal and external recycling, including thermal recycling
- Ratio of recycled waste to waste generated: Recycled waste ÷ waste generated×100
- Ratio of final landfill disposal to waste generated: Final landfill disposal ÷ waste generated×100
- Specially controlled industrial waste: Industrial waste with explosive, toxic, infectious, or other properties that may harm human health or the living environment
Water Resource Related Data
*Horizontally scrollable
| unit | Scope | FY2020 | FY2021 | FY2022 | FY2023 | FY2024 | |
|---|---|---|---|---|---|---|---|
| Water withdrawal | thousand ㎥ | Domestic and overseas | 4,269 | 4,295 | 4,333 | 3,973 | 3,732 |
| Tap water | thousand ㎥ | Domestic | 132 | 137 | 139 | 130 | 130 |
| Overseas | 263 | 284 | 261 | 204 | 17 | ||
| Total | 395 | 421 | 400 | 334 | 147 | ||
| Industrial water | thousand ㎥ | Domestic | 3,367 | 3,558 | 3,513 | 3,202 | 3,158 |
| Overseas | 507 | 315 | 421 | 437 | 427 | ||
| Total | 3,873 | 3,874 | 3,933 | 3,639 | 3,585 | ||
| Surface water (rivers, lakes, marshes, etc.) | thousand ㎥ | Domestic and overseas | 0 | 0 | 0 | 0 | 0 |
| Ground water | thousand ㎥ | Domestic and overseas | 0 | 0 | 0 | 0 | 0 |
| Seawater | thousand ㎥ | Domestic and overseas | 0 | 0 | 0 | 0 | 0 |
| Facilities in water stress areas*1 | locations | Domestic and overseas | - | - | - | - | 1 |
| Total water withdrawal in water stress areas | thousand ㎥ | Domestic and overseas | - | - | - | - | 222 |
| Water consumption*2 | thousand ㎥ | Domestic and overseas | 1,382 | 1,124 | 1,035 | 1,061 | 781 |
| Water discharge*3 | thousand ㎥ | Domestic | 2,738 | 3,039 | 3,024 | 2,711 | 2,772 |
| Overseas | 149 | 132 | 274 | 201 | 180 | ||
| Total | 2,887 | 3,171 | 3,298 | 2,912 | 2,952 | ||
| Water discharged into surface waters (rivers, lakes, marshes, etc.) | thousand ㎥ | Domestic | 1,688 | 1,912 | 1,924 | 1,671 | 1,763 |
| Water discharged underground | thousand ㎥ | Domestic | 0 | 0 | 0 | 0 | 0 |
| Marine discharge | thousand ㎥ | Domestic | 889 | 985 | 955 | 899 | 860 |
| Water discharged to third parties (sewage systems, etc.) | thousand ㎥ | Domestic | 159 | 140 | 144 | 141 | 149 |
| COD in wastewater*3 | tons | Domestic | 117 | 156 | 142 | 115 | 152 |
| Overseas | 23 | 17 | 29 | 26 | 30 | ||
| Total | 140 | 173 | 171 | 142 | 181 | ||
| Total phosphorus emissions in wastewater*3 | tons | Domestic | 0.83 | 0.77 | 0.97 | 0.68 | 0.69 |
| Overseas | 0 | 0 | 0 | 0.01 | 0 | ||
| Total | 0.83 | 0.77 | 0.97 | 0.69 | 0.69 | ||
| Total nitrogen emissions in wastewater*3 | tons | Domestic | 5.1 | 4.2 | 4.0 | 3.0 | 4.6 |
| Overseas | 0.6 | 0.8 | 1.3 | 1.3 | 2.6 | ||
| Total | 5.6 | 5.0 | 5.3 | 4.2 | 7.3 |
- Assessment using the Aqueduct 4.0 Water Risk Atlas from the World Resources Institute (WRI)
Areas where "Water Stress" is "Extremely High" or "High" are defined as water stress areas. - Water consumption: The difference between the volume of water withdrawal and the volume of water discharged
- Excludes San-Dia Polymers (Nantong) Co., Ltd. in FY2024
Chemical Substance Emission Data
Atmospheric Emissions Related Data
*Horizontally scrollable
| unit | Scope | FY2020 | FY2021 | FY2022 | FY2023 | FY2024 | |
|---|---|---|---|---|---|---|---|
| NOx*1 | tons | Domestic | 87 | 39 | 89 | 84 | 50 |
| Overseas | 36 | 20 | 15 | 16 | 1 | ||
| Total | 123 | 60 | 104 | 100 | 51 | ||
| SOx*1 | tons | Domestic | 1.1 | 1.6 | 0.6 | 1.5 | 1.3 |
| Overseas | 10.0 | 5.0 | 4.1 | 6.3 | 0.2 | ||
| Total | 11.1 | 6.6 | 4.7 | 7.8 | 1.5 | ||
| Soot and dust*1 | tons | Domestic | 3.1 | 2.0 | 4.6 | 3.7 | 2.0 |
| Overseas | 3.9 | 2.2 | 1.9 | 2.0 | 0.0 | ||
| Total | 7.0 | 4.2 | 6.5 | 5.7 | 2.0 | ||
| VOC emissions*2 | tons | Domestic | 70 | 73 | 66 | 44 | 39 |
| Overseas | 23 | 17 | 8 | 8 | 4 | ||
| Total | 93 | 90 | 74 | 52 | 43 | ||
| Leakage of flurocarbons*1 | kg | Domestic | 106 | 252 | 102 | 84 | 82 |
| Ozone-depleting substances*3 | kg CFC-11 | 3 | 1 | 1 | 0 | 0 |
- Excludes SDP Global Co., Ltd. in FY2024
- Total atmospheric emission of substances subject to former and current revisions of the PRTR Law, and PRTR substances specified by the Japan Chemical Industry Association.
Due to legal revisions, revisions have been made to substances of concern since FY2023. - Leakage of HCFCs from air conditioners, chillers, etc. based on the Act on Rational Use and Proper Management of Fluorocarbons, converted to CFC-11 equivalent.
- Excludes San-Dia Polymers (Nantong) Co., Ltd. in FY2024
Release/Transfer of Substances Subject to the PRTR Law (domestic sites)
(unit: tons)
*Horizontally scrollable
| FY2020 | FY2021 | FY2022 | FY2023 | FY2024 | |
|---|---|---|---|---|---|
| Atmospheric emissions | 44 | 47 | 42 | 29 | 24 |
| Water emissions | 0.4 | 0.4 | 0.3 | 0.4 | 0.5 |
| Transfer of waste | 365 | 577 | 517 | 361 | 447 |
Release and Transfer of Major Substances Subject to the PRTR Law, by Facility (FY2024)
Substances subject to notification of which at least 0.01 tons of annual emissions were released to the air or water or transferred, or of which at least 0.1 tons were transferred as waste, are listed below.
(unit: tons)
*Horizontally scrollable
| Facility | Control No. | Substance | Atmospheric emissions |
Water emissions |
Transfer of waste |
|---|---|---|---|---|---|
| Nagoya Factory | 4 | Acrylic acid and its water-soluble salts | 0.28 | 0 | 0 |
| 9 | Acrylonitrile | 0.04 | 0 | 0 | |
| 37 | 4,4'-Isopropylidenediphenol | 0 | 0.02 | 0 | |
| 53 | Ethylbenzene | 0.08 | 0.03 | 143 | |
| 56 | Ethylene oxide | 0.07 | 0 | 0 | |
| 58 | Ethylene glycol monomethyl ether | 0.07 | 0 | 0 | |
| 66 | 1,2-Epoxybutane | 0.35 | 0 | 0 | |
| 68 | 1,2-Epoxypropane (also known as propylene oxide) |
1.42 | 0 | 0 | |
| 80 | Xylene | 0.05 | 0.03 | 4.8 | |
| 134 | Vinyl acetate | 0.05 | 0 | 0 | |
| 178 | 1,2-Dichloropropane | 0.80 | 0 | 0.1 | |
| 232 | N,N-Dimethylformamide | 0.12 | 0.08 | 57.1 | |
| 300 | Toluene | 1.83 | 0 | 0.2 | |
| 398 | Benzyl chloride | 0.03 | 0 | 0 | |
| 405 | Boron compounds | 0 | 0.04 | 0 | |
| 674 | Tetrahydrofuran | 0.09 | 0 | 0 | |
| 737 | Methyl isobutyl ketone | 0.05 | 0 | 0 | |
|
97 substances Total emissions or |
5.35 | 0.37 | 89.3 | ||
| Kashima Factory | 3 | Ethyl acrylate | 0.01 | 0 | 0 |
| 4 | Acrylic acid and its water-soluble salts | 0.02 | 0 | 0 | |
| 7 | n-Butyl acrylate | 0.09 | 0 | 0 | |
| 8 | Methyl acrylate | 0.07 | 0 | 0 | |
| 53 | Ethylbenzene | 0.83 | 0.02 | 92.5 | |
| 65 | Epichlorohydrin | 1.40 | 0 | 5.1 | |
| 80 | Xylene | 0.49 | 0.01 | 69.7 | |
| 123 | 3-Chloropropene | 0.63 | 0 | 0 | |
| 128 | Chloromethane | 4.19 | 0 | 0 | |
| 134 | Vinyl acetate | 0.29 | 0 | 0 | |
| 232 | N,N-Dimethylformamide | 0.03 | 0 | 28.5 | |
| 240 | Styrene | 0.16 | 0 | 3.7 | |
| 270 | Terephthalic acid | 0 | 0 | 0.3 | |
| 273 | 1-Dodecanol | 0 | 0 | 0.1 | |
| 277 | Triethylamine | 0 | 0 | 2.0 | |
| 300 | Toluene | 0.60 | 0.05 | 0 | |
| 351 | 1,3-Butadiene | 0.01 | 0 | 0 | |
| 415 | Methacrylic acid | 0.19 | 0 | 28.0 | |
| 420 | Methyl methacrylate | 3.36 | 0 | 30.7 | |
| 511 | Dibenzyl ether | 0 | 0 | 2.3 | |
| 564 | 2-Ethylhexyl Acrylate | 0 | 0 | 0.9 | |
| 629 | Cyclohexane | 2.76 | 0 | 0 | |
|
65 substances Total emissions or |
15.15 | 0.12 | 264.9 | ||
| Kyoto Factory | 53 | Ethylbenzene | 0 | 0 | 13.7 |
| 80 | Xylene | 0 | 0 | 9.2 | |
| 232 | N,N-Dimethylformamide | 0 | 0 | 42.4 | |
| 300 | Toluene | 0 | 0 | 5.0 | |
| 420 | Methyl methacrylate | 0.03 | 0 | 1.4 | |
|
66 substances Total emissions or |
0.04 | 0 | 71.8 | ||
| Kinuura Factory | 56 | Ethylene oxide | 0.06 | 0 | 0 |
| 68 | 1,2-Epoxypropane (also known as propylene oxide) |
0.18 | 0 | 0 | |
|
3 substances Total emissions or |
0.25 | 0 | 0 | ||
| San Chemical Co., Ltd. | 56 | Ethylene oxide | 0.10 | 0 | 0 |
| 68 | 1,2-Epoxypropane (also known as propylene oxide) |
0.35 | 0 | 0 | |
|
35 substances Total emissions or |
0.45 | 0 | 0 | ||
| SDP Global Co., Ltd. | 4 | Acrylic acid and its water-soluble salts | 0.77 | 0 | 0 |
|
3 substances Total emissions or |
0.77 | 0 | 0.2 | ||
| SAN NOPCO LIMITED | 4 | Acrylic acid and its water-soluble salts | 0.02 | 0 | 0 |
| 8 | Methyl acrylate | 0.01 | 0 | 0 | |
| 30 | Linear alkylbenzene sulfonic acid and its salts (limited to those with alkyl chains of 10 to 14 carbon atoms and their mixtures) | 0 | 0 | 0.1 | |
| 53 | Ethylbenzene | 0 | 0 | 0.2 | |
| 80 | Xylene | 0 | 0 | 0.1 | |
| 300 | Toluene | 0.09 | 0 | 2.6 | |
| 407 | Polyoxyethylene alkyl ether | 0 | 0 | 0.2 | |
| 737 | Methyl isobutyl ketone | 0.40 | 0 | 0 | |
|
68 substances Total emissions or |
0.57 | 0 | 3.4 | ||
| San-Petrochemicals Co., Ltd. | 190 | Dicyclopentadiene | 0.06 | 0 | 3.2 |
| 337 | 4-Vinyl-1-cyclohexene | 0.22 | 0 | 0.2 | |
| 351 | 1,3-Butadiene | 0.08 | 0 | 0 | |
| 400 | Benzene | 0.05 | 0 | 0 | |
| 590 | Ethylidene norbornene | 1.27 | 0 | 7.8 | |
|
7 substances Total emissions or |
1.68 | 0 | 11.2 | ||
*Horizontally scrollable
Dioxins
(unit: mgTEQ)
| Facility | Control No. | Substance | Atmospheric emissions | Water emissions | Transfer of waste |
|---|---|---|---|---|---|
| Nagoya Factory | 243 | Dioxins | 0.13 | 2.54 | 107.23 |
| Kyoto Factory | 243 | Dioxins | 0.47 | 0.08 | 0.19 |
*Horizontally scrollable
Atmospheric Emissions of Major Substances Subject to the PRTR Law (domestic sites)
(unit: tons)
| Control No. | Substance | FY2001 | FY2020 | FY2021 | FY2022 | FY2023 | FY2024 |
|---|---|---|---|---|---|---|---|
| 4 | Acrylic acid | 4.9 | 10.4 | 5.0 | 6.1 | 2.0 | 1.1 |
| 9 | Acrylonitrile | 13.0 | 0.1 | 0.1 | 0 | 0 | 0 |
| 53 | Ethylbenzene | 3.8 | 1.1 | 1.2 | 1.2 | 0.9 | 0.9 |
| 56 | Ethylene oxide | 17.9 | 0.5 | 0.3 | 0.3 | 0.2 | 0.2 |
| 65 | Epichlorohydrin | 1.0 | 1.4 | 1.4 | 1.4 | 1.5 | 1.4 |
| 68 | Propylene oxide | 56.2 | 3.3 | 3.4 | 2.3 | 2.0 | 2.0 |
| 80 | Xylene | 4.6 | 0.6 | 0.7 | 0.7 | 0.5 | 0.5 |
| 128 | Chloromethane | 9.2 | 17.8 | 17.2 | 15.1 | 6.1 | 4.2 |
| 157 | 1,2-Dichloroethane | 4.3 | 0.6 | 0.4 | 0.4 | 0.1 | 0.0 |
| 178 | 1,2-Dichloropropane | 3.0 | 0.8 | 1.0 | 0.9 | 1.1 | 0.8 |
| 232 | N,N-Dimethylformamide | 2.6 | 0.2 | 0.2 | 0.2 | 0.2 | 0.2 |
| 240 | Styrene | 1.6 | 0.2 | 0.2 | 0.2 | 0.1 | 0.2 |
| 300 | Toluene | 30.2 | 0.7 | 8.6 | 5.6 | 4.4 | 2.5 |
| 351 | 1,3-Butadiene | 3.2 | 0.1 | 0.1 | 0.1 | 0.2 | 0.1 |
| 420 | Methyl methacrylate | 19.3 | 4.5 | 4.8 | 4.8 | 4.0 | 3.4 |
Main PRTR Measures, and VOC Emission Reduction Measures and Results
*Horizontally scrollable
| Implemented (FY) |
Facility | Measures | Result | Reduction per year (tons) |
|---|---|---|---|---|
| 2001 | Nagoya Factory | Improvement of propylene oxide receiving system | Propylene oxide emissions to the air | 50 |
| 2001-2005 | San-Petrochemicals Co., Ltd. | Process improvement | Butadiene emissions to the air | 1.4 |
| 2001-2005 | Nagoya Factory, Kashima Factory | Reduction of chlorinated solvents (process changes, replacements, discontinuations, etc.) | 1,2-Dichloroethane, etc. emissions to the air | 7 |
| 2002-2004 | Kyoto Factory | Production process improvement and emissions cooling system installation | Methyl methacrylate emissions to the air | 9 |
| 2002 | Nagoya Factory | Replacement and/or discontinuation | Hydrogen fluoride and its water-soluble salts emissions to water | 0.6 |
| 2003 | Nagoya Factory | VOC adsorption system installation | Mainly acrylonitrile emissions to the air | 25 |
| 2004 | San Chemical Co., Ltd. (Kawasaki Factory) |
Propylene oxide emissions combustion system installation | Propylene oxide emissions to the air | 6 |
| 2005 | Kashima Factory | Production process improvement | Methyl methacrylate emissions to the air | 3 |
| 2005 | Nagoya Factory | VOC adsorption system installation | Mainly toluene emissions to the air | 17 |
| 2005 | Nagoya Factory | Ethylene oxide emissions processing system installation | Ethylene oxide emissions to the air | 20 |
| 2005 | SDP Global Co., Ltd. (Ogaki Production Dept.) | Cyclohexane adsorption/collection system installation | Cyclohexane emissions to the air | 300 |
| 2006 | Kashima Factory | Cooling system enhancement | Methyl methacrylate emissions to the air | 4 |
| 2007 | Nagoya Factory | VOC adsorption/collection system installation | Dichloropropane, etc. emissions to the air | 5 |
| 2007 | Kyoto Factory | VOC adsorption/collection system installation | Ethyl acetate emissions to the air | 12 |
| 2008 | Nagoya Factory | Cooling system enhancement | Hexane, methyl ethylketone emissions to the air | 12 |
| 2009 | Nagoya Factory | VOC adsorption/collection system installation | Hexane, methyl ethylketone emissions to the air | 45 |
| 2010 | Kyoto Factory | VOC removal system installation | Methyl methacrylate emissions to the air | 4 |
| 2012 | Kinuura Factory | Propylene oxide emissions combustion system installation | Propylene oxide emissions to the air | 8 |
| 2012 | San Chemical Co., Ltd. (Kawasaki Factory) |
Propylene oxide emissions combustion system installation | Propylene oxide emissions to the air | 1.5 |
| 2015 | Kashima Factory | VOC removal system installation | Ethyl acetate emissions to the air | 150 |
| Methyl methacrylate emissions to the air | 18 | |||
| 2018 | SDP Global Co., Ltd. (Ogaki Production Dept.) | Facility closure | Cyclohexane emissions to the air | 14 |
| 2020 | Nagoya Factory | Production process improvement, etc. | Propylene oxide emissions to the air | 0.7 |
| 2020 | Sanyo Kasei (Nantong) Co., Ltd. | VOC combustion/adsorption/collection system installation | Dichloropropane, ethyl acetate, etc. emissions to the air | 9.4 |
| 2022 | Kashima Factory | Production process improvement | Chloromethane emissions to the air | 9.0 |
| Nagoya Factory | Cooling system enhancement | Mainly toluene emissions to the air | ||
| 2023 | Kashima Factory | Production process improvement | Chloromethane emissions to the air | 1.2 |