Unless otherwise specified, the figures include employees transferred to domestic and overseas subsidiaries and affiliates.
Employee Related Data
Change in Consolidated Number of Employees
*Horizontally scrollable
| unit | FY2020 | FY2021 | FY2022 | FY2023 | FY2024 | |
|---|---|---|---|---|---|---|
| Number of employees | People | 2,096 | 2,106 | 2,089 | 2,042 | 1,680 |
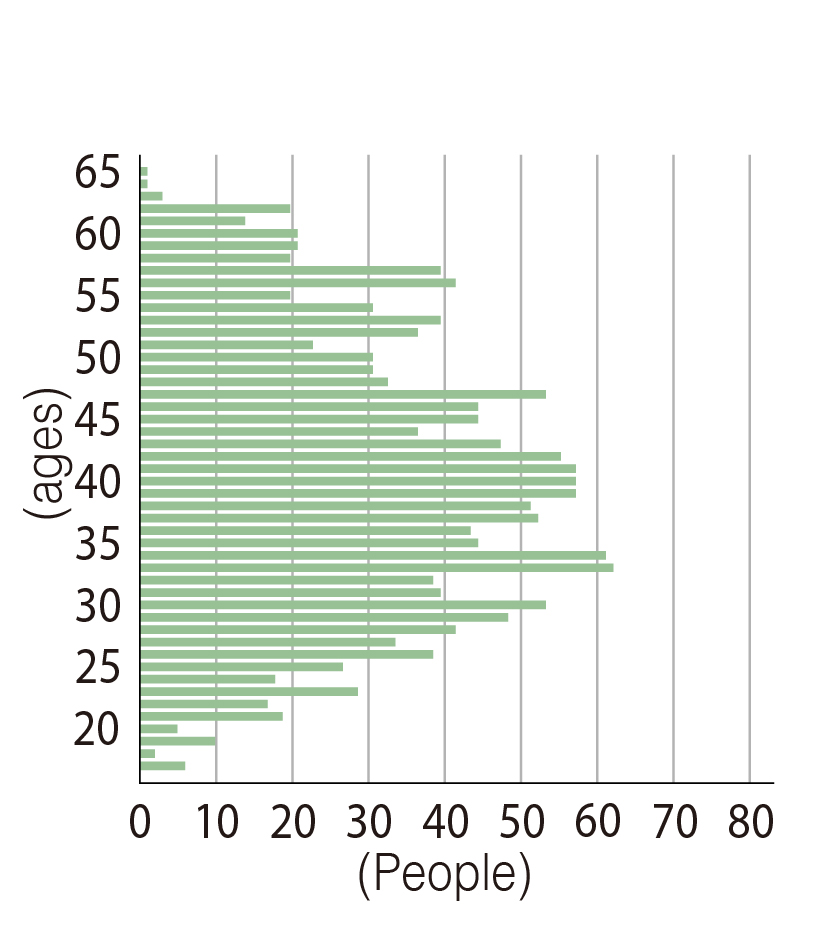
Employee age structure
(as of March 31, 2025)
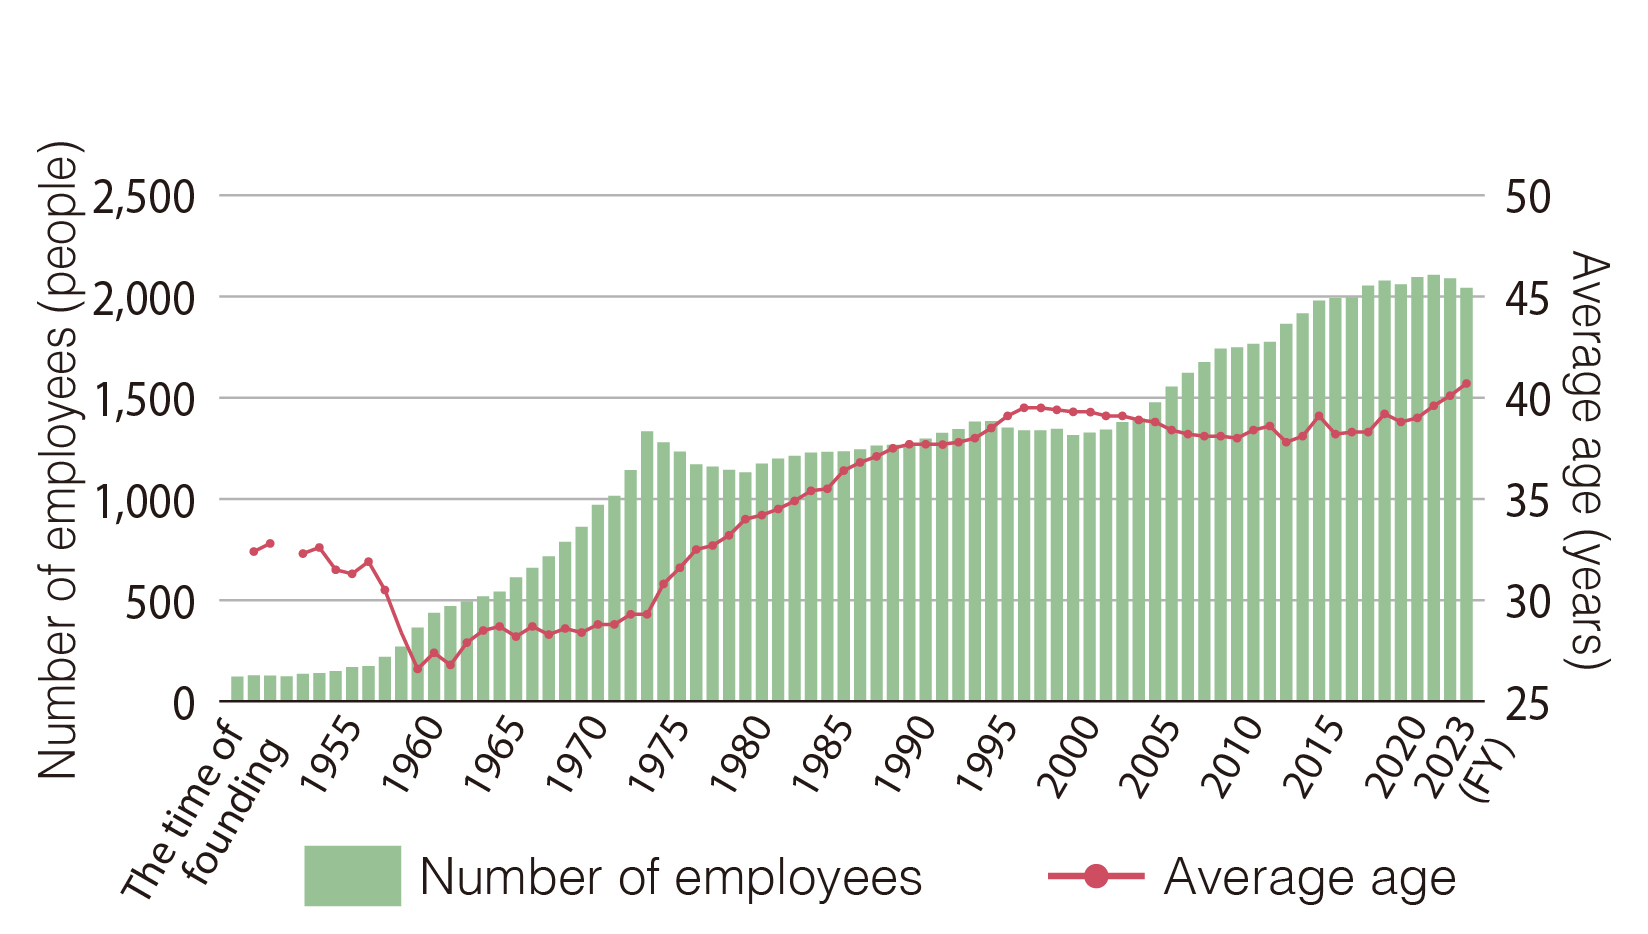
Number of employees and average age
*Horizontally scrollable
Employees and average age
Number of Employees by Type of Employment
*Horizontally scrollable
| FY2020 | FY2021 | FY2022 | FY2023 | FY2024 | |||
|---|---|---|---|---|---|---|---|
| Domestic | Sanyo Chemical Industries | Regular | 1,305 | 1,282 | 1,249 | 1,224 | 1,213 |
| Non-regular | 191 | 206 | 226 | 208 | 164 | ||
| Domestic subsidiaries and affiliates | Regular | 239 | 284 | 276 | 274 | 203 | |
| Non-regular | 52 | 44 | 57 | 56 | 48 | ||
| Overseas | USA | Regular | 13 | 15 | 14 | 12 | 11 |
| Non-regular | 0 | 0 | 0 | 0 | 0 | ||
| ASEAN | Regular | 169 | 178 | 183 | 164 | 93 | |
| Non-regular | 11 | 11 | 17 | 17 | 16 | ||
- In the Domestic section, domestic subsidiaries and affiliates include employees of joint ventures transferred to joint ventures
- In the Overseas section, the total number of employees in the United States includes local hires from Sanyo Chemical Texas Industries, LLC. In ASEAN, the total number of employees included local hires from SDP GLOBAL (MALAYSIA) SDN. BHD. (up to FY2023) and Sanyo Kasei (Thailand) Ltd.
- Overseas figures exclude the number of employees at overseas sales bases.
- As of March 31 of each fiscal year
Employment Status
*Horizontally scrollable
| unit | FY2020 | FY2021 | FY2022 | FY2023 | FY2024 | |||
|---|---|---|---|---|---|---|---|---|
| Regular | Men | People | 1,278 | 1,281 | 1,237 | 1,202 | 1,136 | |
| Women | 300 | 319 | 323 | 326 | 330 | |||
| Ratio of women | % | 19.0 | 19.9 | 20.7 | 21.3 | 22.5 | ||
| Managerial staff | Men | People | 316 | 312 | 309 | 312 | 304 | |
| Women | 13 | 15 | 16 | 16 | 16 | |||
| Female manager ratio | % | 4.0 | 4.6 | 4.9 | 4.9 | 5.0 | ||
| New hires | New employees | Men | People | 25 | 30 | 16 | 19 | 14 |
| Women | 8 | 15 | 5 | 12 | 9 | |||
| Mid-career hires | Men | People | 10 | 6 | 7 | 3 | 7 | |
| Women | 6 | 3 | 4 | 2 | 7 | |||
| Total | People | 49 | 54 | 32 | 36 | 37 | ||
| Turnover up to three years after joining the company | People | 5 | 5 | 5 | 8 | 3 | ||
| % | 9.6 | 6.8 | 9.1 | 17.8 | 14.3 | |||
| Employment of people with disabilities | People | 26 | 26 | 27 | 26 | 32 | ||
| Percentage of employees with disabilities*1 | % | 2.17 | 2.09 | 2.23 | 2.06 | 2.71 | ||
| Reemployment of retired employees | Men | People | 13 | 19 | 20 | 19 | 28 | |
| Women | 1 | 1 | 0 | 0 | 1 | |||
| Reemployment rate of retired employees | % | 81 | 87 | 100 | 79 | 74 | ||
| Number of non-Japanese employees | Men | People | 6 | 6 | 5 | 5 | 6 | |
| Women | 6 | 7 | 7 | 6 | 8 | |||
| Average years of employment | Years old | 15.9 | 16.5 | 17.0 | 16.6 | 17.2 | ||
| Number of regular employees who left the company*2 | Men | People | 12 | 21 | 32 | 37 | 46 | |
| Women | 1 | 8 | 4 | 14 | 11 | |||
| Regular employee turnover | % | 0.8 | 1.8 | 2.3 | 3.3 | 3.9 | ||
- Employment rate of people with disabilities: Reported as of June 1 of the relevant fiscal year
- Number of regular employees who left the company: Number of employees who voluntarily retired
Hours Worked
*Horizontally scrollable
| unit | FY2020 | FY2021 | FY2022 | FY2023 | FY2024 | |
|---|---|---|---|---|---|---|
| Annual workdays | Days | 237 | 239 | 238 | 239 | 238 |
| Annual holidays | Days | 129 | 126 | 127 | 126 | 128 |
| Annual regular working hours | Hours | 1,837 | 1,852 | 1,845 | 1,852 | 1,845 |
| Monthly average overtime work | Hours/Person | 4.4 | 4.8 | 5.2 | 5.5 | 5.6 |
| Paid leave usage ratio | % | 58.5 | 50.6 | 70.2 | 70.4 | 68.6 |
Work-life Balance
*Horizontally scrollable
| unit | FY2020 | FY2021 | FY2022 | FY2023 | FY2024 | ||
|---|---|---|---|---|---|---|---|
| Maternity leave acquisition | People | 14 | 12 | 17 | 15 | 12 | |
| Employees on childcare leave | Men | People | 40 | 47 | 55 | 61 | 37 |
| Women | 17 | 11 | 17 | 10 | 17 | ||
| Percentage of male employees taking childcare leave*1 | % | 66.7 | 79.7 | 98.2 | 92.4 | 92.5 | |
| Rate of employees returning to work after childcare leave*2 | % | 100 | 100 | 100 | 98.8 | 100 | |
| Average number of days of childcare leave taken per person*3 | Men | Days | 11 | 8 | 16 | 27 | 46 |
| Women | 307 | 321 | 350 | 331 | 403 | ||
| Reduced work hours for childcare | Men | People | 0 | 0 | 0 | 0 | 1 |
| Women | 12 | 4 | 6 | 7 | 5 | ||
| Retention rate after returning to work after childcare leave*4 | % | 100 | 100 | 100 | 92.6 | 96.3 | |
| Employees on nursing care leave | People | 1 | 1 | 1 | 2 | 0 | |
| Employees on reduced working hours for nursing care | People | 0 | 0 | 0 | 0 | 0 | |
- Percentage of male employees taking childcare leave = Male employees who took childcare leave / Male employees whose spouse gave birth × 100
- Rate of employees returning to work after childcare leave = Employees returning to work / Employees intending to return to work × 100
- Average number of days taken per person = Total number of days taken by returning employees for the current fiscal year ÷ Returning employees for the current fiscal year
- Retention rate after returning to work after childcare leave = Employees returning to work in the previous fiscal year and were employed at the Company as of March 31 of the current fiscal year / Employees returning to work in the previous fiscal year x 100
Labor Accidents
*Horizontally scrollable
| FY2020 | FY2021 | FY2022 | FY2023 | FY2024 | |
|---|---|---|---|---|---|
| Employee lost-time injuries (cases) | 0 | 6 | 1 | 1 | 1 |
| Of the above employees lost-time injuries, fatal injuries (cases) | 0 | 0 | 0 | 0 | 0 |
| Employee lost-time injury frequency rate*1 | 0 | 1.61 | 0.27 | 0.29 | 0.34 |
| Employee lost-time injury severity rate*2 | 0 | 0.05 | 0.05 | 0.01 | 0.00 |
| Subcontractor lost-time injuries (cases) | 2 | 2 | 3 | 2 | 1 |
| Of the above subcontractor lost-time injuries, fatal injuries (cases) | 0 | 1 | 0 | 0 | 0 |
| Subcontractor lost-time injury frequency rate*1 | 1.94 | 1.69 | 2.37 | 1.59 | 0.97 |
| Subcontractor lost-time injury severity rate*2 | 0.04 | 6.33 | 0.13 | 0.03 | 0.01 |
| Employee injuries without lost time (cases) | 2 | 2 | 7 | 10 | 4 |
| Subcontractor injuries without lost time (cases) | 5 | 4 | 5 | 4 | 3 |
- Frequency rate = (number of lost-time injury victims) / (total hours) / 1,000,000 Index of frequency of lost-time injuries per 1 million hours
- Severity rate = (number of days of lost work) / (total working hours) / 1,000 Value indicating severity of injuries per 1,000 working hours
Gender Pay Gap
(unit: %)
*Horizontally scrollable
| FY2020 | FY2021 | FY2022 | FY2023 | FY2024 | |
|---|---|---|---|---|---|
| All workers*1*2*3 | - | - | 68.8 | 68.9 | 69.6 |
| Of the above all workers, regular employees as a percentage of all workers | - | - | 73.8 | 72.9 | 72.9 |
| Of the above all workers, part-time and fixed-term workers as a percentage of all workers*4 | - | - | 42.5 | 46.1 | 41.8 |
- Workers include those transferred to subsidiaries and affiliates.
- Calculated based on provisions of the "Act on the Promotion of Women's Active Engagement in Professional Life" (Act No. 64 of 2015).
- In our HR system, there is no gap in wages between men and women in the same position or role.
- Includes retiree rehires, part-timer workers, and fixed-term contract employees, and excludes dispatched workers. The wage gap in this group is due to the fact that many retiree rehires are men with higher wage levels, including those treated as managers.
Education and Training
Cost of Education per Employee
*Horizontally scrollable
| Content | unit | FY2021 | FY2022 | FY2023 | FY2024 |
|---|---|---|---|---|---|
| Compulsory training (promotion/advancement training, etc.) | Cost (thousand yen/person) | - | - | 43 | 30 |
| Duration (hours/person) | - | - | 4.9 | 4.4 | |
| Environment-related courses and qualification courses (production* and research organizations) |
Cost (thousand yen/person) | 5 | 3 | 4 | 9 |
- Includes locally hired employees of overseas and affiliates
Skill Improvement and Career Development
*Horizontally scrollable
| Name/description | Eligible participants |
unit | FY2021 | FY2022 | FY2023 | FY2024 | |
|---|---|---|---|---|---|---|---|
| Law course | Education on important laws such as the Act on the Evaluation of Chemical Substances and Regulation of Their Manufacture, etc. | Research and production |
Participants (people) |
84 | 68 | 69 | 86 |
| Insider trading regulations | New and mid-career hires |
53 | 24 | 39 | 68 | ||
| Export Trade Control Order | Sales and research |
104 | 85 | 32 | 56 | ||
| Other (contract basics, Subcontract Act, etc.) | All employees |
Number of courses / Total number of participants (cases/people) |
- | 5/407 | 6/419 | 7/545 | |
| Basic research course | Research | Course graduates (people) |
38 | 56 | 61 | 51 | |
| MOT School, Coaching Training, Critical Thinking Training, Design Thinking Training* |
Number of trainings / Participants (cases/people) |
12/48 | 12/56 | 9/26 | - | ||
| R&D Academy* | Participants (people) | - | - | - | 22 | ||
| Introductory Career Development Training | New employees | Participants (people) | - | - | 12 | 25 | |
| Career Development Training (Career Plan Formulation) | Mid-career employees in their 30s | Participants (people) | - | - | 104 | 77 | |
| Career Development Supporter Training | Career Planning Workshop Supervisors of participants | Participants (people) | - | - | 80 | 32 | |
| “Dojo” forums for executives and employees to hold dialogues | All employees |
Number of dojos held / Number of participants (cases/people) |
- | 26/181 | 7/64 | 12/112 | |
- MOT schools and e-learning programs held via external institutions ended in FY2024, and the R&D Academy was opened in FY2025.
Safety/Technology Education
*Horizontally scrollable
| FY2020 | FY2021 | FY2022 | FY2023 | FY2024 | ||
|---|---|---|---|---|---|---|
| Participants (People) | Employees (including transfers) |
93 | 168 | 96 | 169 | 153 |
| Subcontractor employees | 12 | 35 | 20 | 141 | 44 | |
| Safety and Technology Education Center visitors and guests (People) | 19 | 55 | 47 | 109 | 206 | |
| Education time (total hours) | - | - | - | - | 3,454 | |
Global Human Resource Development
(unit: Person)
*Horizontally scrollable
| FY2020 | FY2021 | FY2022 | FY2023 | FY2024 | |
|---|---|---|---|---|---|
| Study abroad | 0 | 0 | 1 | 1 | 0 |
| Overseas training | 0 | - | - | 0 | 0 |
| Expatriate development program | 2 | 1 | 1 | 1 | 0 |
Improving Health Literacy (FY2024)
*Horizontally scrollable
| Seminar content | Participants (people) | Total time* (hours) | Comprehension (%) | Satisfaction (%) |
|---|---|---|---|---|
| Seminar on burning fat and reducing belly fat | Approx. 280 | Approx. 280 | 92 | 88 |
| Responsible drinking seminar | Approx. 300 | Approx. 300 | 95 | 89 |
| Sleep and stretching seminar | Approx. 270 | Approx. 270 | 88 | 87 |
- Participants × Hours participated
Human Rights Education and Awareness-raising (FY2024)
*Horizontally scrollable
| Item | Number of trainings (cases) | Total number of participants (people) | Total time* (hours) |
|---|---|---|---|
| Human rights / compliance | 2 | 1,475 | 2,950 |
| DEI promotion | 2 | 190 | 243 |
| Women’s participation and advancement | 4 | 166 | 488.5 |
| LGBTQ | 3 | 112 | 140 |
| Employment of people with disabilities | 1 | 23 | 11.5 |
- Participants × Hours participated
Commendation Programs
(unit: cases)
*Horizontally scrollable
| FY2021 | FY2022 | FY2023 | FY2024 | |
|---|---|---|---|---|
| Commendations from the President* | 31 | 33 | 28 | 1 |
| Awards from General Managers to Encourage Challenge Taking | 344 | 522 | 492 | 415 |
| INVENTOR OF THE YEAR | 4 | 5 | 4 | 4 |
- Commendation criteria changed in FY2024
Health and Productivity Management Data
Action Goals
(unit: %)
*Horizontally scrollable
| Initiatives | Action goals | FY2020 | FY2021 | FY2022 | FY2023 | FY2024 | FY2025 target |
|---|---|---|---|---|---|---|---|
| Exercise | To have an exercise routine at least once a week | 31 | 50 | 50 | 52 | 52 | 70 or above |
| Sleep | To be well rested with sleep | 57 | 66 | 63 | 61 | 59 | 80 or above |
| Diet | To have a balanced diet | - | 76 | 75 | 79 | 82 | 90 or above |
| Alcohol | Two or more alcohol-free days per week | 75 | 75 | 76 | 77 | 79 | 90 or above |
| Smoking | Not to smoke (smoking rate reduction) | 77 | 82 | 83 | 84 | 82 | 90 or above |
- Percentage of respondents who responded to the annual questionnaire on lifestyle habits related to health management, etc., and said that they were implementing it.
Checkups and Guidance
(unit: %)
*Horizontally scrollable
| FY2020 | FY2021 | FY2022 | FY2023 | FY2024 | FY2025 target |
|
|---|---|---|---|---|---|---|
| Rate of regular health checkups | 100 | 100 | 100 | 100 | 100 | 100 |
| Rate of full medical checkups | 68 | 89 | 96 | 88 | 93 | 100 |
| Rate of specific health guidance | 80 | 94 | 95 | 98 | 100 | 100 |
Lifestyle-related Disease Risk Retention Rate (health checkup results)
(unit: %)
*Horizontally scrollable
| FY2020 | FY2021 | FY2022 | FY2023 | FY2024 | FY2025 target |
|
|---|---|---|---|---|---|---|
| Obesity | 26 | 25 | 25 | 25 | 27 | 20 or less |
| Liver function | 34 | 31 | 34 | 33 | 33 | 30 or less |
| Fats | 57 | 55 | 56 | 55 | 54 | 50 or less |
| Blood sugar | 17 | 21 | 17 | 20 | 26 | 15 or less |
| Blood pressure | 37 | 34 | 29 | 33 | 33 | 30 or less |
| Triple risk holders (fats, blood sugar, and blood pressure) |
8 | 8 | 5 | 7 | 8 | 5 or less |
Mental Health Measures
*Horizontally scrollable
| FY2020 | FY2021 | FY2022 | FY2023 | FY2024 | |
|---|---|---|---|---|---|
| Stress check test rate (%) | 99 | 98 | 99 | 98 | 99 |
| High stress rate (%) | 8.9 | 8.6 | 7.1 | 8.0 | 8.3 |
Health Management Evaluation Indicators
*Horizontally scrollable
| FY2020 | FY2021 | FY2022 | FY2023 | FY2024 | FY2025 target |
|
|---|---|---|---|---|---|---|
| Absenteeism*1 Personal injury/sickness absence rate (%) |
1.5 | 1.8 | 1.9 | 1.3 | 1.6 | 1.0 or less |
| Presenteeism*2 Labor productivity loss rate (%) |
- | 37.5 | 36.6 | 36.4 | 35.8 | 30 or less |
| Work engagement*3 Self-motivated behavior and positive feelings toward work (deviation value) |
- | 49.7 | 50.1 | 49.6 | 49.7 | 51 or above |
- A condition in which the employee cannot perform duties due to absence from work, leave of absence, or other reasons. Measured by the number of employees on sick leave who are absent for at least one month.
- A condition in which the employee is present at work but is not able to work sufficiently due to mental or physical health problems. Measured by the WHO Health and Labor Performance Questionnaire.
- A state of mind that is positive and full of accomplishment, vitality, enthusiasm, and immersion in one’s work. Measured by a proprietary survey instrument using eight items that correlate well with the Utrecht Work Engagement Scale.
Communication
Dialogue with Stakeholders
(Times conducted: times)
*Horizontally scrollable
| FY2020 | FY2021 | FY2022 | FY2023 | FY2024 | |
|---|---|---|---|---|---|
| Financial results announcements for the media | 2 | 2 | 2 | 2 | 2 |
| Financial results briefings for institutional investors and securities analysts | 2 | 2 | 2 | 2 | 2 |
| Small meetings with institutional investors and securities analysts | 3 | 1 | 2 | 0 | 2 |
| Meetings with institutional investors and securities analysts (1-on-1) | 83 | 70 | 58 | 81 | 57 |
| Business site visits for institutional investors and securities analysts | 0 | 0 | 0 | 1 | 0 |
| Financial results briefings for individual investors | 0 | 0 | 0 | 0 | 1 |
Society Contributions
Donations
(unit: million yen)
*Horizontally scrollable
| FY2020 | FY2021 | FY2022 | FY2023 | FY2024 | ||
|---|---|---|---|---|---|---|
| Total social contribution expenditures | 24.2 | 36.4 | 34.9 | 30.1 | 25.6 | |
| Donations by item | 1. Support for academic promotion centered on chemistry | 14.8 | 27.0 | 14.1 | 13.6 | 11.6 |
| 2. Support for human resource development | 3.1 | 0.3 | 2.3 | 3.3 | 3.9 | |
| 3. Support for the preservation of art and culture, etc. mainly in Kyoto | 0.5 | 1.0 | 4.1 | 4.0 | 4.0 | |
| 4. Support for and collaboration on environmental conservation activities | 1.6 | 1.6 | 1.5 | 1.6 | 2.2 | |
| 5. Support for and collaboration on social contribution activities wherever possible according to local social needs in each country and region | 4.2 | 6.5 | 13.0 | 7.6 | 3.9 | |
- Expenditures by Sanyo Chemical Foundation for Social Contribution
On-site Chemistry Classes Held
Upper row: Number of times held (units: schools, cases), Lower row: number of participants (units: people)
*Horizontally scrollable
| District | FY2020 | FY2021 | FY2022 | FY2023 | FY2024 | Instructors |
|---|---|---|---|---|---|---|
| Kyoto area | 4 | 6 | 6 | 7 | 5 | R&D and head office employees |
| 209 | 446 | 335 | 436 | 276 | ||
| Nagoya Factory | 0 | 1 | 2 | 2 | 2 | Nagoya Factory employees |
| 0 | 73 | 250 | 200 | 211 | ||
| Kashima Factory | 0 | 1 | 4 | 4 | 3 | Kashima Factory employees |
| 0 | 50*1 | 255*2 | 372*2 | 171*2 |
- Estimate of event participants
- Includes estimated event participants
Sanyo Chemical Forestry
Activity location: Yubune District, Wazuka Town, Soraku-gun, Kyoto Prefecture, Japan
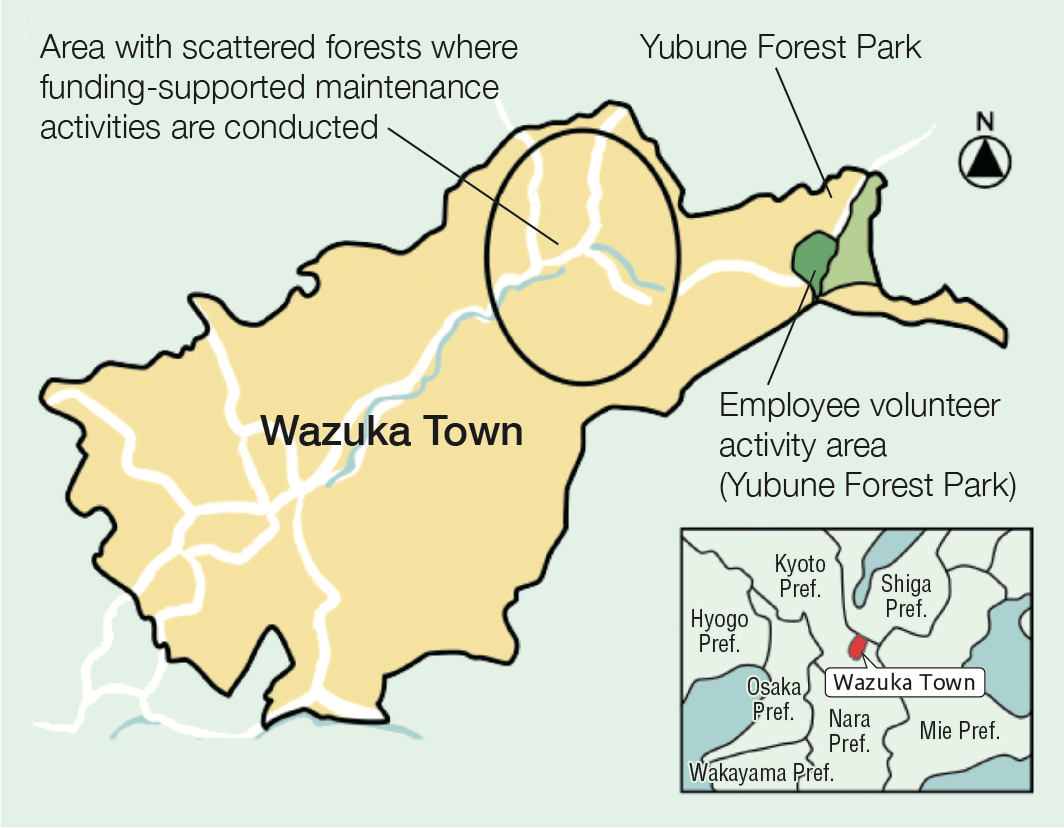
Volunteer Forestry Activities by Employees
*Horizontally scrollable
| unit | FY2020 | FY2021 | FY2022 | FY2023 | FY2024 | ||
|---|---|---|---|---|---|---|---|
| Sanyo Chemical’s forestry activities | Times conducted | Times | 2 | 1 | 3 | 3 | 2 |
| Total number of participants | People | 60 | 34 | 101 | 123 | 68 | |
| Supporter Association* | Times conducted | Times | 7 | 4 | 7 | 8 | 7 |
| Total number of participants | People | 63 | 28 | 63 | 62 | 53 | |
(FY2024 results)
*Horizontally scrollable
| Date conducted, etc. | Participants (people) | Activity details | |
|---|---|---|---|
| New employee training | April 5, 2024 | 25 | Promenade staircase improvement |
| 28th Forestry Activity | March 15, 2025 | 43 | Fire making lesson, boil-in-bag cooking (beef bowl) |
| Supporter Association* | 7 times in total | 53 | Forestry activity preparation, improvement of promenades, etc. |
- Supporter Association: Forest volunteer activities by employees, their families, and retired employees. The number of participants was the total number of people
Funding-supported Tree Thinning Project
*Horizontally scrollable
| unit | FY2020 | FY2021 | FY2022 | FY2023 | FY2024 | Cumulative since FY2009 | |
|---|---|---|---|---|---|---|---|
| Thinned area | ha | 3.5 | 3.7 | 2.4 | 2.2 | 2.2 | 63.1 |
| Increase in CO2 absorption | Tons CO2/year | 12.6 | 38.5 | 10.6 | 20.0 | 12.7 | 396.0 |
- Implemented from FY2009
Rice Farming in Futagotanada
*Horizontally scrollable
| unit | FY2020 | FY2021 | FY2022 | FY2023 | FY2024 | |
|---|---|---|---|---|---|---|
| Terraced rice field area | ㎡ | 400 | 400 | 400 | 400 | 400 |
| Times conducted | Times | 8 | 9 | 14 | 8 | 11 |
| Total number of participants | People | 45 | 74 | 71 | 79 | 77 |
| Rice yield | kg | 230 | 240 | 270 | 230 | 280 |
| Of the above rice yield, donations to children's cafeterias | kg | 60 | 60 | 90 | 60 | 90 |